The world's data.
Yours to chart.
Charts and posts from one editor. The world's indicators built in, every country, sourced and dated.
No account needed to try it · see the examples
World BankIMFClimate WatchSee methodology
Charts and posts
One studio.
The editor, working: a line, then the story's own shape, marked where it matters, then the same record as a post. Open any story and keep going. Out as PNG, SVG or CSV.
Posts
Adjust it to your brand.
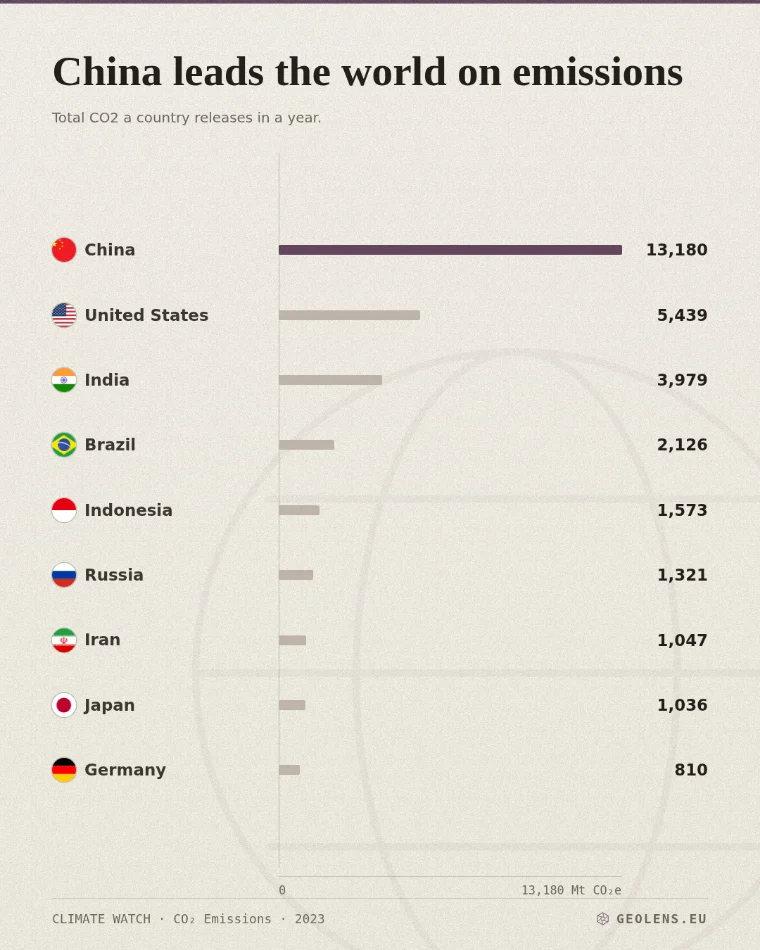
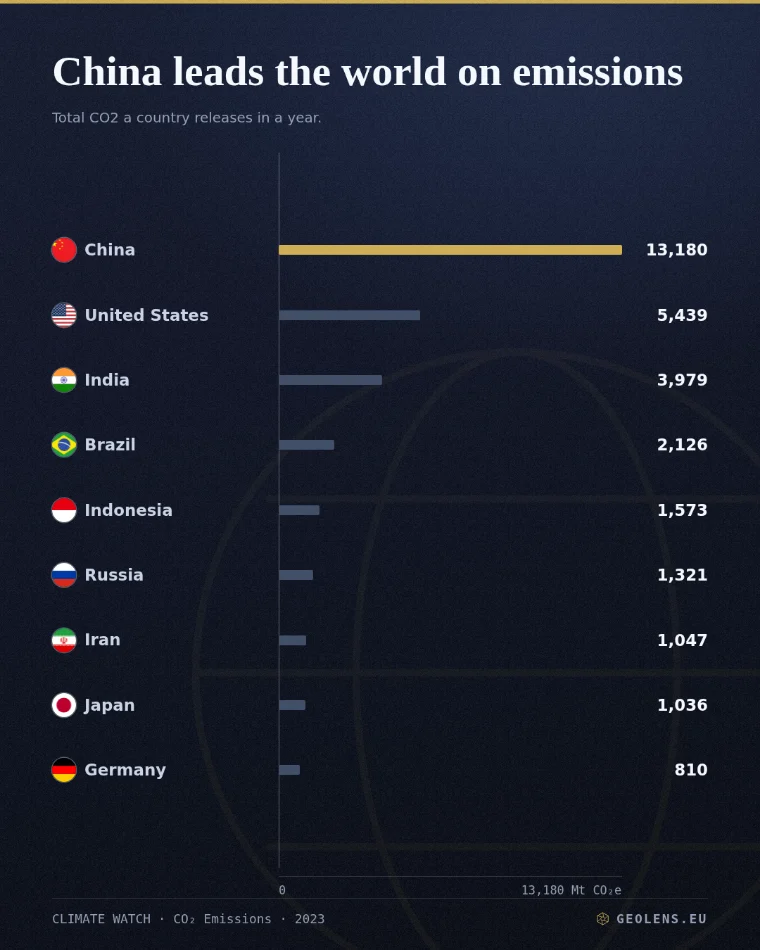
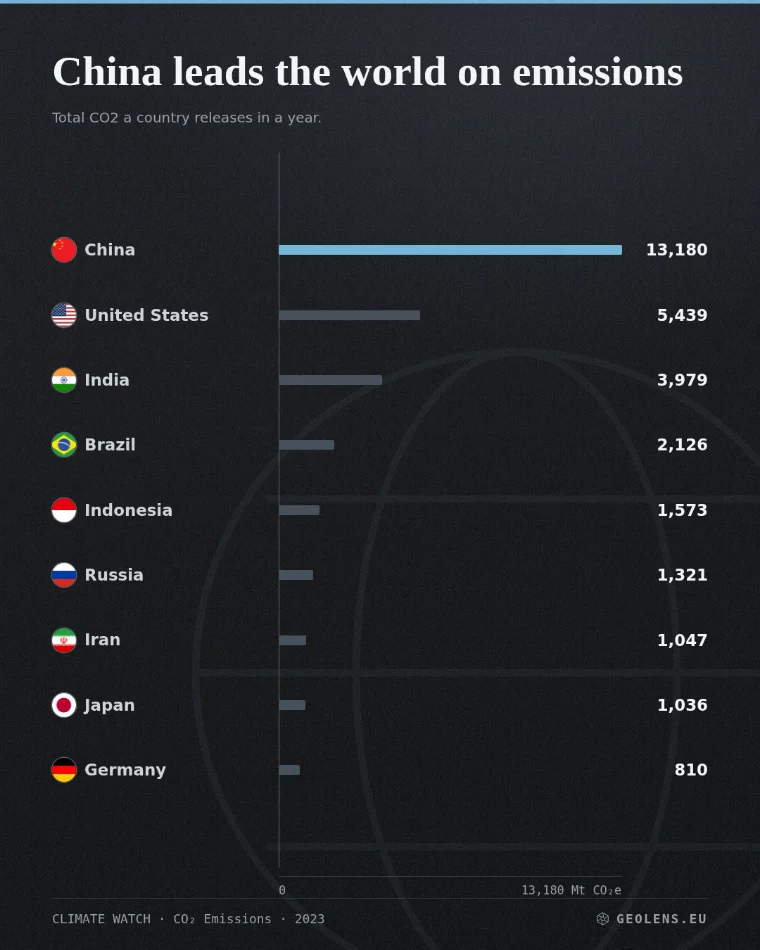
Five themes, two typefaces, an accent of your own, and your logo in place of ours. One post, four layouts, out as a PNG sized for a feed.
Open the post editor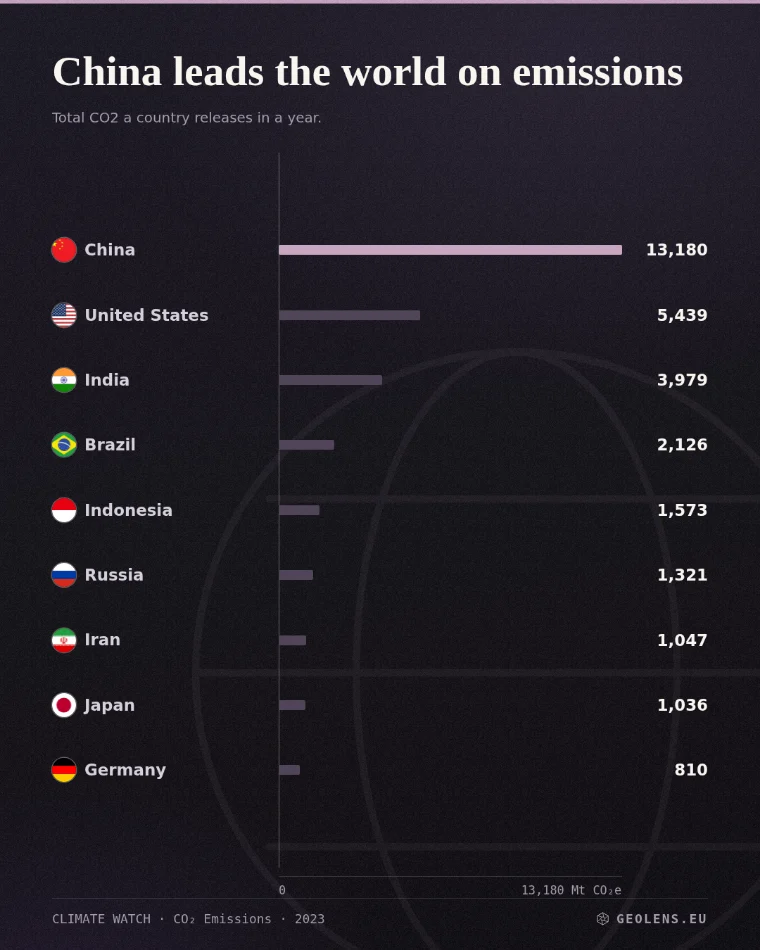
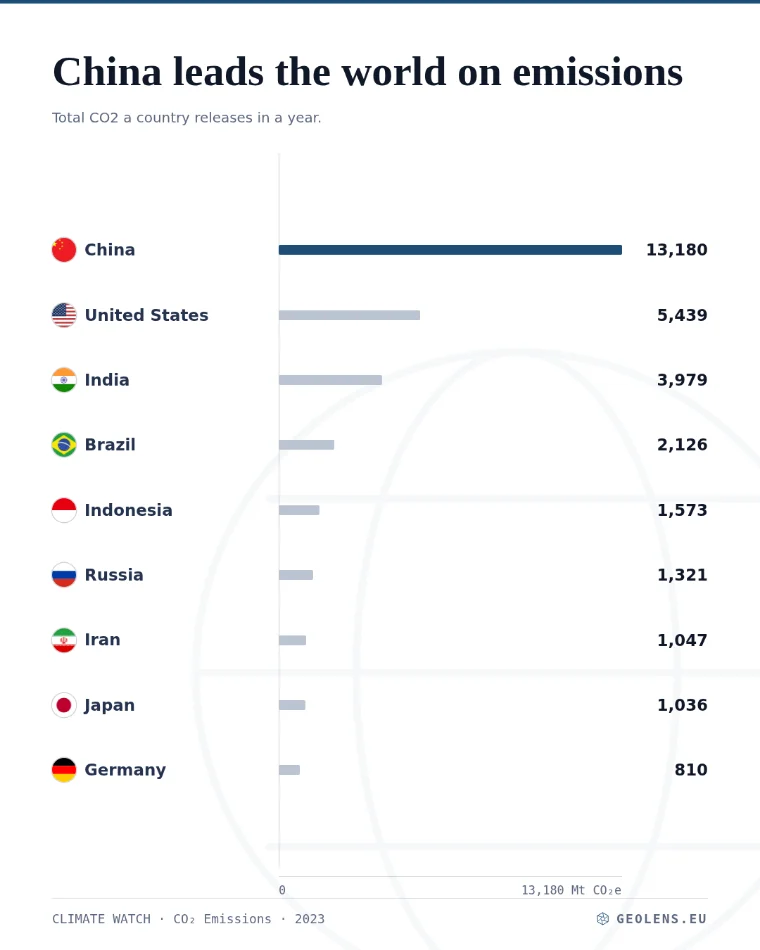
Explore
Not sure yet? Start here.
Every indicator, as a map and as a ranked table. Compare a few countries and turn what you find into a post.
Open Explore


Questions
Frequently asked.
What can I make?
Two things, from one record in one editor: a chart in six shapes, and a post in four layouts. Change the countries on the chart and the post follows, because they are the same piece of work.
Where does the data come from?
World Bank, IMF and Climate Watch, built in and refreshed on their release schedules. Every chart and post carries its source and the indicator code it drew.
Do I need my own spreadsheet?
No, every country's full history is already loaded, nothing to clean. You can also bring your own, countries by year, pasted, as a CSV or TSV, or from a Google Sheet, on the paid plan.
Can I try it without an account?
Yes: making and editing both work signed out. Downloading asks for a free account, and nothing else does.
Who owns what I make?
You do. Nothing is locked in: download your work and take it anywhere.